
From Developer Preference to Agent-Led Growth
How developer priorities shape the choices coding agents make, and what those choices mean for developer tool adoption.
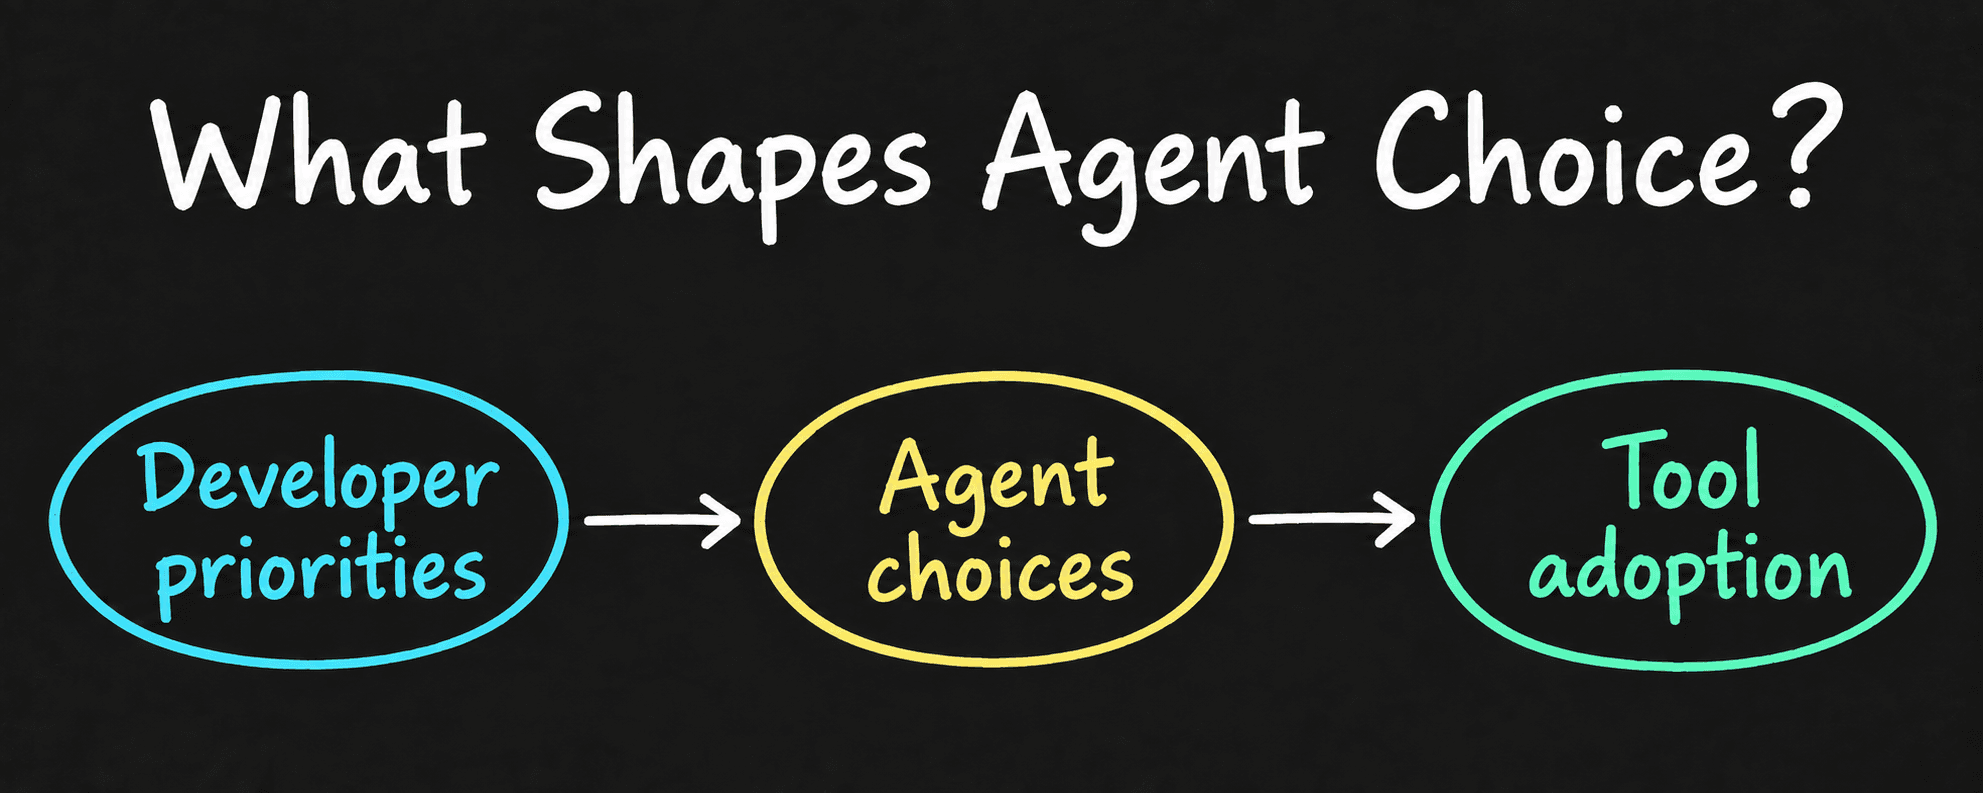
We see AI shifting developers’ attention from writing code to designing systems that meet business goals. As shipping faster becomes a priority, we want to understand how developer preferences change and how they shape the choices coding agents make. These choices have implications for the distribution and economics of developer tool companies.
Coding agents and their orchestrators are shaped by developer preferences, which are themselves changing with AI adoption. As generated code becomes more readily accepted, we see a growing need to understand how agents use a company’s information to find and integrate its tools. The time and effort this requires can influence whether a tool gets adopted, connecting the information agents encounter to business outcomes.
Routing companies offer one example of how developer economic choices enter this process. Decisions about how much time and money to spend on a task influence which models perform the work. Examining agent behavior under these constraints help us understand how those choices affect the tools agents favor and how they use them.
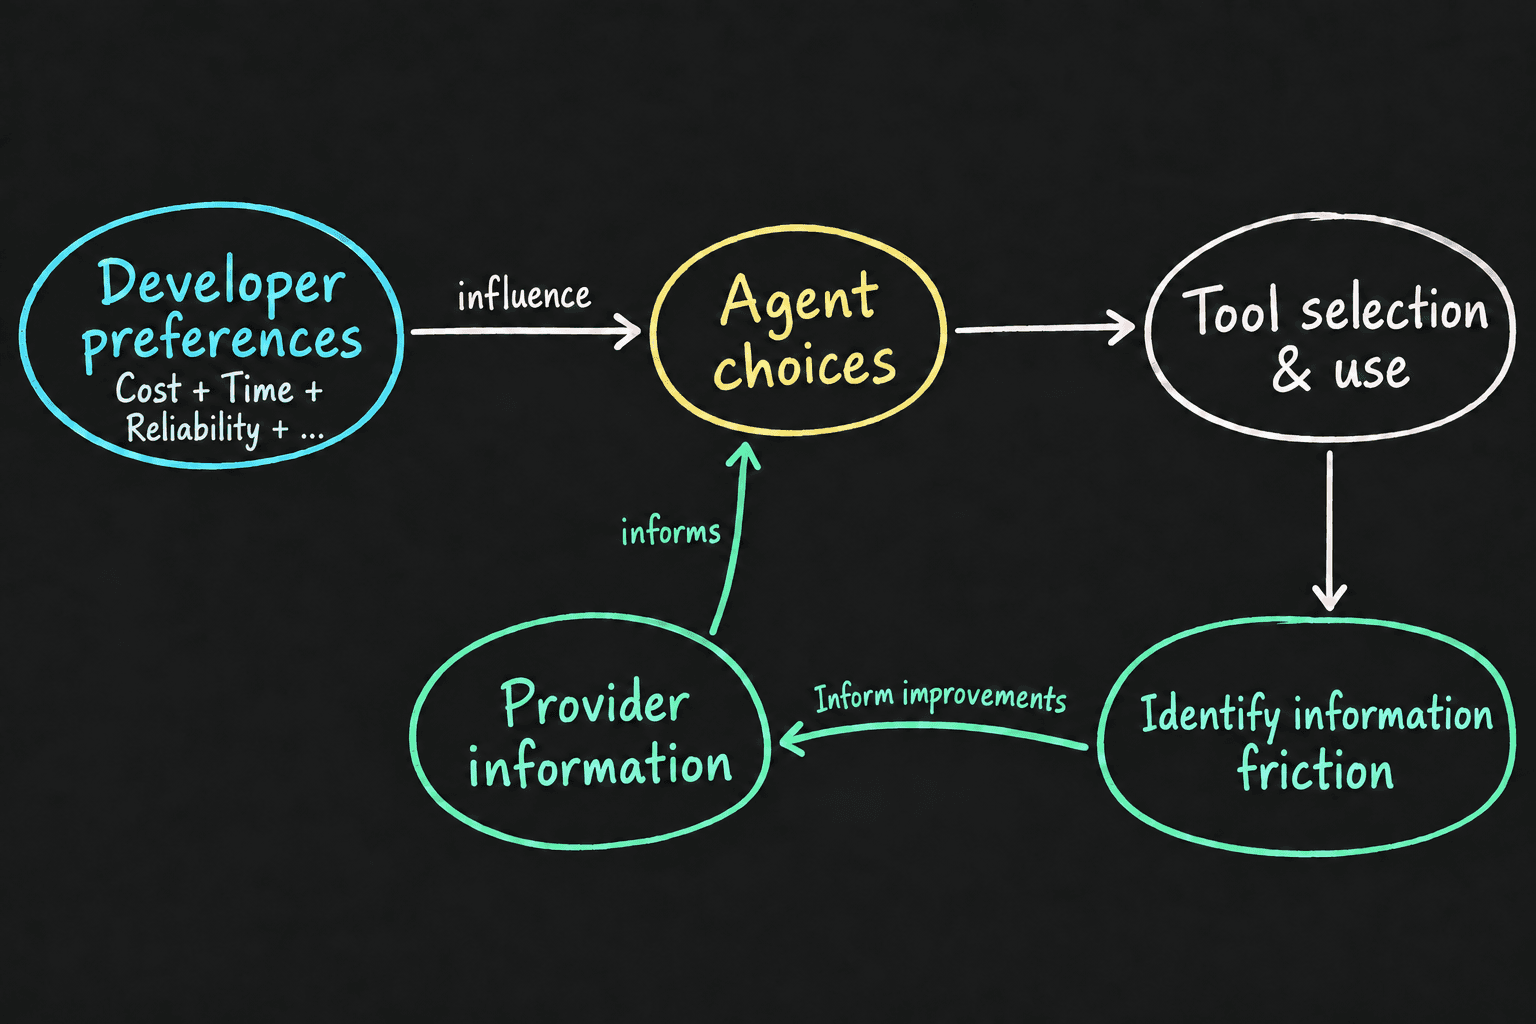
Meaningful comparison starts with the same task under comparable conditions. Its capability frontier consists of providers offering the strongest tradeoffs across Cost, Latency, and Reliability. Developer priorities can favor different points on that frontier, helping explain agent preference. A domain-wide average can obscure which capabilities each provider actually performs well.
In these comparison charts, quality means task success. The Morphiq Agent Experience Map pairs it with MAXI, an overall experience score.
Payments All tasks All coding agents
Morphiq Agent Experience Map
- Four-objective task frontier
- Dominated in this task
- Current task frontier
- Quality interval
The Pareto Frontier graphs compare task success with cost, time, or validated friction. The cost view below shows how quality relates to the average cost of completing a task.
Payments All tasks All coding agents
Provider Pareto Frontier
- Four-objective task frontier
- Dominated in this task
- Current task frontier
- Quality interval
- Cost · Average
- Lower is better
- Quality
- Higher is better
The friction view compares task success with validated friction. Reading it alongside cost and time helps explain the tradeoffs involved in choosing and using a tool.
Payments All tasks All coding agents
Provider Pareto Frontier
- Four-objective task frontier
- Dominated in this task
- Current task frontier
- Quality interval
- Friction · Average
- Lower is better
- Quality
- Higher is better
These concerns about cost, time, and reliability also matter for developer tool businesses. As model providers pursue greater efficiency and intelligence, tool providers must improve the presence of their information and the reliability with which their tools can be integrated and used. This is where we see an opportunity to address the friction developers encounter through their agents and understand how reducing it could support adoption and growth.
About Morphiq and what Morphiq does
Morphiq enables Agent Experience (AX) engineers to simulate relevant developer scenarios across their product’s capabilities and isolate coding-agent friction attributable to provider-controlled information. We help companies improve how agents discover, integrate, and use their tools. Learn more at trymorphiq.com.


.svg)